Net income
Overview
Use this report to examine net income for your institution for a fiscal year.
Slicers
This report provides filtering options that let you create a set of data, giving you the option of viewing the precise data you want to view.
Entity
The entity dropdown lists all of the clinics, hospitals, and other entities that comprise your institution. You can choose to view all of those entities, or select a single entity to view.
Service line
This drop-down lists all of the service lines defined for your institution. You can view all service lines or one or more individual service lines. To select multiple service lines, press and hold the <Ctrl> key while you select.
Patient type
The patient drops-down lists the ways a patient was seen, such as inpatient or outpatient emergency. The list shows the patient types used in your organization.
Financial class
This drop-down lists types of payers. You can view all payers or one or more individual payers. To select multiple payer, press and hold the <Ctrl> key while you select.
Fiscal year
This drop-down lists fiscal years that you can select for viewing.
TIP: Use the dashboard tools to view, export, and sort the data; view data as table; and more.
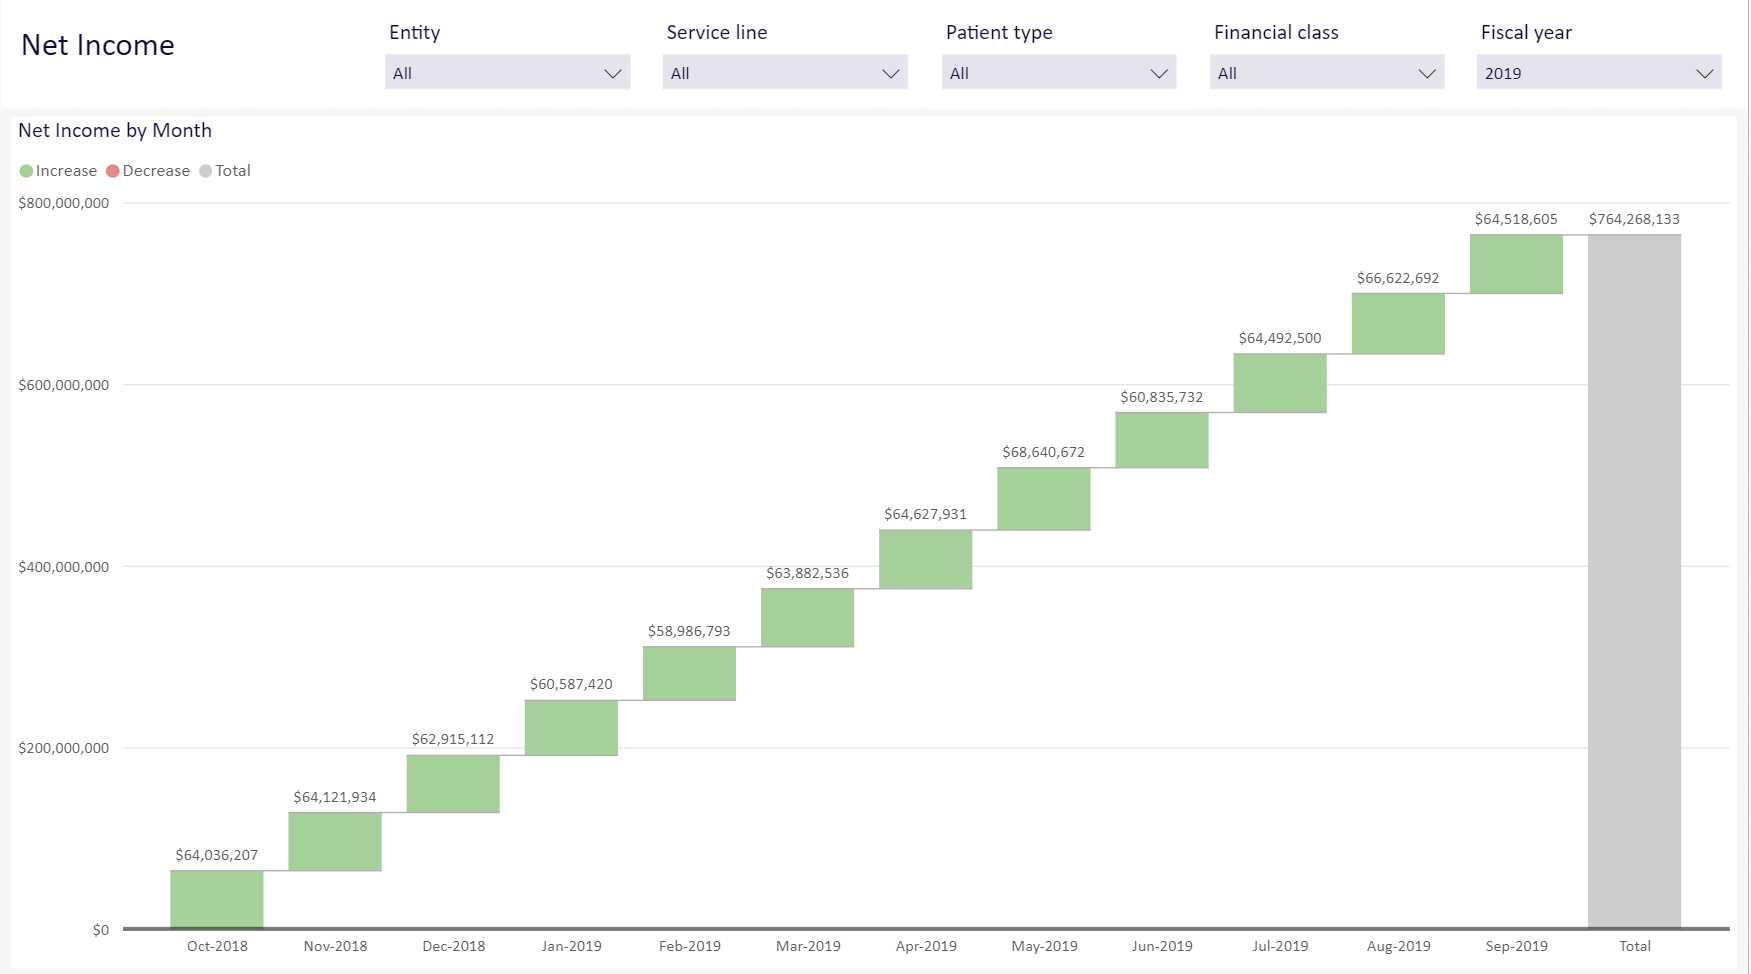
Net Income By Month
This waterfall chart shows you, month by month, the net income for the fiscal year. All charts start at $0, and a chart may either an increase or a decrease. It also shows the total on the right side of the chart.
Click image to view full size
Navigation
-
Use the tabs at the bottom of the page to view other related reports in the category.
-
Use the Navigation menu in the upper-left corner to return to Recent places that you've visited or to the Intelligence Center.